项目详见:
https://github.com/ahomer/airbnb_bst
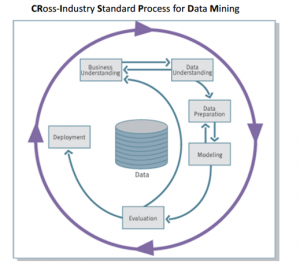
Business and Data Understanding
As talk on Airbnb kaggle data website, the following Airbnb activity is included in this Boston dataset:
- Calendar, including listing id and the price and availability for that day
- Listings, including full descriptions and average review score
- Reviews, including unique id for each reviewer and detailed comments
Let us take a look on these three csv files.
Calendar
It shows that the hosts are not avaible everyday and price may be changed at the busiest seasons.
- What is the most expensive season in Boston?
- Which hosts are the most favorite?
Listings
Summary information on listing in Boston.It contains location, host information, cleaning and guest fees, amenities and so on.
We may find some import factors on price.
- What are the top factors strong relation to price?
- How to predict price?
Reviews
We can find many interesting opinions,sush as
- What are the most attractive facilities? It is big bed, large room or location?
- What will lead to bad impression?
Data preparing
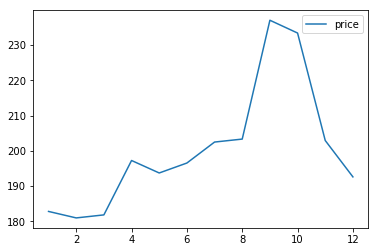
Clean Calendar
-
So we can see the most expensive season is from August to November,especial September and October.
-
You can get a lowest price if you go to Boston at February.
-
The most expensive listing_id is 447826.Go to Boston and experience one night.
|
301 |
| id |
447826 |
| listing_url |
https://www.airbnb.com/rooms/447826 |
| scrape_id |
20160906204935 |
| host_url |
https://www.airbnb.com/users/show/2053557 |
| name |
Sweet Little House in JP, Boston |
| bedrooms |
1 |
| accommodates |
2 |
| bathrooms |
1 |
| amenities |
{TV,"Cable TV",Internet,"Wireless Internet",Ki... |

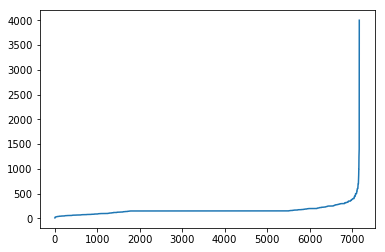
Clean Listings
Let us calculate the mean/std of 'Price'.
- Assuming that prices obey normal distribution
- The price should be between mean-2std~mean+2std
Clean Reviews
Review the reviews.csv file,you will find there are different languages.We just need to keep the english comment.
We need a lib 'langdetect'.
Modeling and evaluation
Let's try to predict the price based on the columns in the listing we selected.
- What are the top factors strong relation to price?
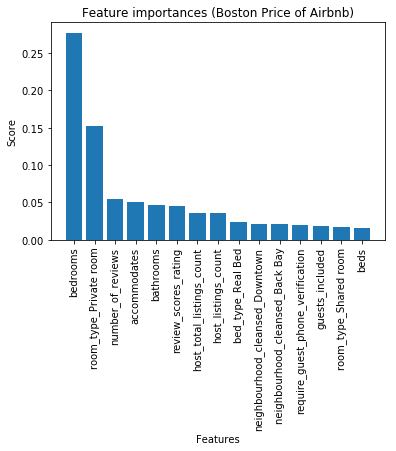
Top 6 factors strong relation to price:
- bedrooms
- room type : Private room
- number of reviews
- accommodates
- bathrooms
- review scores rating
Deployment
Mostly,the model will be deplyed on product environment based on a RPC server or http server.
You can deploy the model with Tornado(python web framework).